 vs

Bear Analytics vs Explori
Both are in our Measurement & analytics category. Bear Analytics is best for associations and trade show organizers that want registration pacing and audience analytics across several events; Explori is best for exhibition organisers tracking exhibitor renewal and audience quality.
Built from each vendor's own website and our research profiles. How we research
Quick verdict
Choose Bear Analytics if:
- Its best fit describes you: associations and trade show organizers that want registration pacing and audience analytics across several events.
- You want a published starting price (From $900/month); Explori is quote-based.
- You need a listed Salesforce integration.
- This matters to you: Prebuilt connectors for association and trade show systems (AMS, housing, exhibitor and registration vendors) that general BI tools lack.
Choose Explori if:
- Its best fit describes you: exhibition organisers tracking exhibitor renewal and audience quality.
- This matters to you: Benchmark database built from 10,000+ events measured since 2012.
Based only on what each vendor publishes. Ask both for a demo with your own event scenario before you decide.
No screenshot
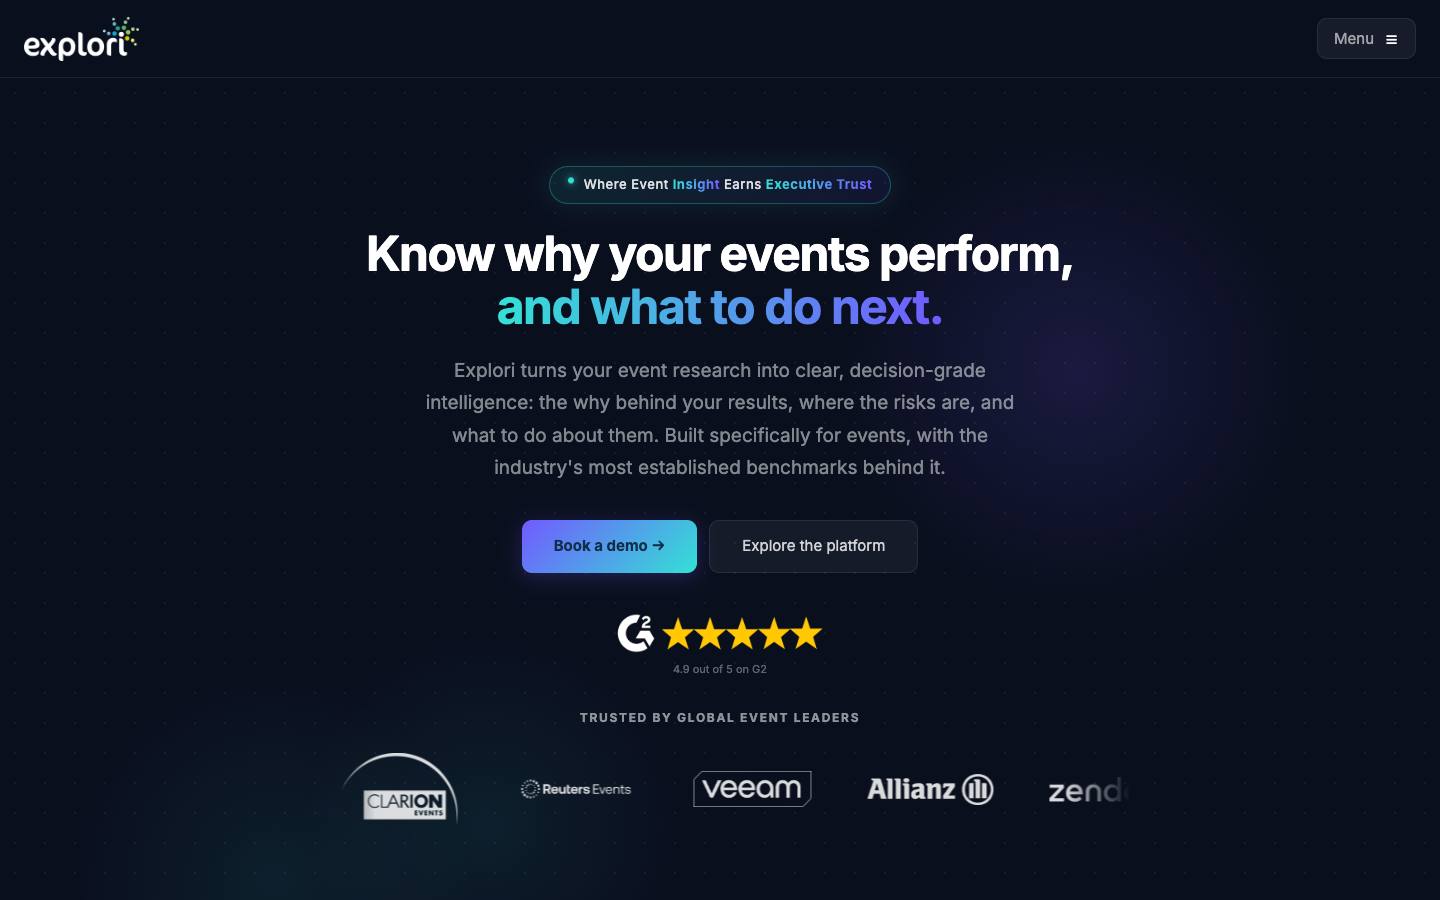 explori.comVisit ↗
Side by side
“Not published” means we couldn't find it on the vendor's own pages.
FeatureBear AnalyticsExplori
Bear AnalyticsExploriOverview
CategoryMeasurement & analyticsMeasurement & analytics
Company size fitMid-market, EnterpriseMid-market, Enterprise
Event formatsIn-person, Virtual, HybridAny formatFrom product type
Capterra rating––
Product updatesNot published2 in the last 90 days
ReliabilityNo incidents in 90 daysNot published
Pricing
Starting price$900/month (Starter, 2,000 attendees and exhibitors per year) sourceQuote-based (no published price)
Pricing modelAnnual subscriptionAnnual subscription
Free planNoNo
Free trialNoNo
Per-event pricing––
Integrations
CRM & marketing automationSalesforce Marketing Cloud, Pardot, HubSpot, Salesforce, Pardot / Account EngagementNone listed
Integrations listed321
Security & ITWhat each vendor documents on its own public pages. "Not found" means we couldn't find it; many vendors share documents on request.
SOC 2 Type IINot foundNot found
SOC 2 Type INot foundNot found
ISO 27001Not foundNot found
Data processing agreement (DPA)Not foundNot found
PCI DSSNot foundNot found
Subprocessor listNot foundNot found
EU data hostingNot foundNot found
HIPAANot foundNot found
SAML single sign-onNot foundNot found
SCIM user provisioningNot foundNot found
Public APINot foundNot found
WebhooksNot foundNot found
Accessibility report (VPAT/ACR)Not foundNot found
Accessibility statementNot foundNot found
Trust centerNot foundNot found
Public status pageNot foundNot found
Public changelogNot foundNot found
Buying details
ImplementationBear's team builds the connectors with the customer's registration and exhibit vendors; customers describe it as quick to stand upSelf-serve platform or managed research run end to end by Explori's research team; reports delivered in days
SupportKnowledge base and support portal (support.bearanalytics.com)Expert support scaled to how much the team does itself; Enterprise adds dedicated account management
ContractAnnualNot published
Mobile appsNot publishedNot published
Company
Founded20132012
HeadquartersArlington, Virginia, USUK
Employees11-50–
OwnershipIndependent, venture-backed (about $2.92M raised per CB Insights)–
Strengths and considerations
Bear Analytics
What stands out
- Prebuilt connectors for association and trade show systems (AMS, housing, exhibitor and registration vendors) that general BI tools lack
- Published pricing with unlimited users and events
- Benchmarked, standardized event metrics across a portfolio
Worth checking
- Analytics only; it doesn't handle registration, check-in or event delivery
- Pricing scales with annual attendee, exhibitor and prospect record volumes
- No named security certifications such as SOC 2 on the security page
Explori
What stands out
- Benchmark database built from 10,000+ events measured since 2012
- Focus on executive-ready measurement rather than event execution
- Serves both exhibition organisers and corporate event marketers
Worth checking
- Measurement only; needs a separate registration and event management platform
- Prices aren't published
- Integrations aren't documented beyond registration data import
Notable customers
Organizations each vendor names on its own website: customer stories first, then testimonials and logos.
Bear Analytics vs Explori: FAQ
Is Bear Analytics cheaper than Explori?
Bear Analytics lists pricing from $900/month (Starter, 2,000 attendees and exhibitors per year), on a annual subscription model. Explori doesn't publish a starting price; pricing is quote-based. Compare a quote against the published price for the same scope.
Which integrates with Salesforce, Bear Analytics or Explori?
Bear Analytics lists a Salesforce integration; Explori doesn't list one. Bear Analytics lists a HubSpot integration; Explori doesn't list one. Bear Analytics lists 32 integrations and Explori lists 1 on their websites.
Which has SOC 2 Type II, Bear Analytics or Explori?
We didn't find a SOC 2 Type II report on Bear Analytics' public pages, and we didn't find a SOC 2 Type II report on Explori's public pages (checked 2026-10-18). Vendors often share security reports under NDA, so ask both directly.
What's the difference between Bear Analytics and Explori?
Both are in our Measurement & analytics category. Bear Analytics is best for associations and trade show organizers that want registration pacing and audience analytics across several events. Explori is best for exhibition organisers tracking exhibitor renewal and audience quality.